Sep 16–30, 2025Partial month
Publishing begins and earns the first 13 campaign clicks.
13Clicks234Impressions16/dayAvg. imp.

From September 16, 2025 through August 31, 2026, The Mighty Quill built a search-led content program that generated 1,889 Google clicks and 179,528 impressions. August became the strongest month yet, producing 47,852 impressions and extending the campaign’s momentum.
The Client
CampusMind is a Sacramento-rooted student wellbeing and engagement initiative for higher education. Today it offers anonymous campus-wellbeing and resilience tools for students while developing institutional technology designed to support student success.
The Challenge
From September 4–15, 2025, CampusMind recorded zero Google clicks and just 64 impressions. Visibility was limited to branded searches, so the site was not yet being discovered for the higher-education questions its audience was actively asking.
Google clicks
Google impressions
Queries only
Baseline period
What We Did
By August 7, 2026, the campaign had already built a library of 71 published, indexable articles around the questions students and institutional leaders research.
Topics centered on student services, campus wellbeing, advising, engagement, retention, and higher-education technology.
Clear answers, useful subtopics, and consistent information architecture helped search engines and AI assistants understand each article.
A steady publishing cadence from September 16, 2025 through August 7, 2026 expanded CampusMind beyond branded discovery.
The Results
The clean baseline and completed campaign period show the shift clearly. Average daily impressions rose from 5.3 before publishing to 513 through August 31—about 96× the baseline pace.
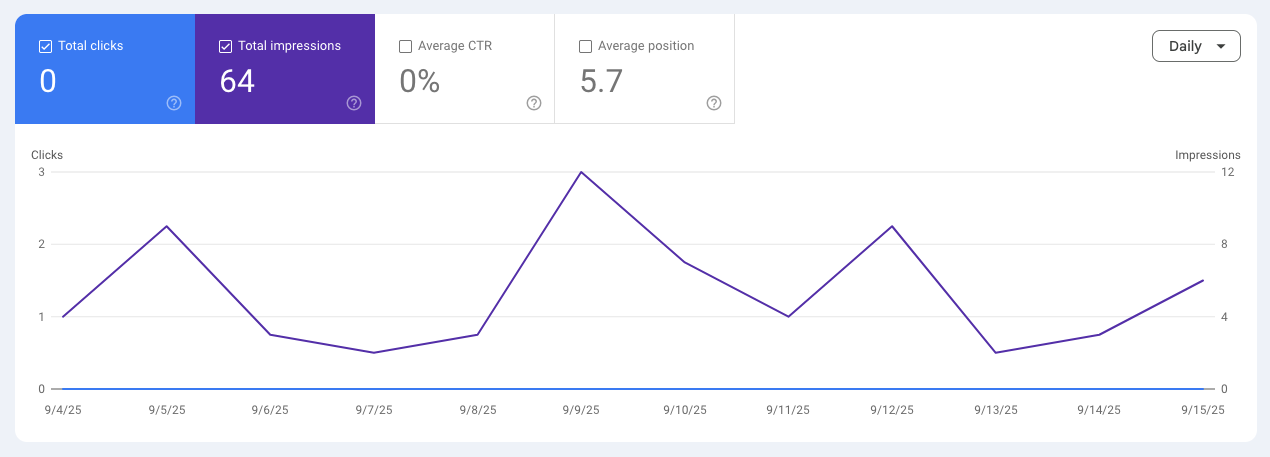

The image above is the August 15 verification capture. The completed campaign period through August 31 reached 1,889 clicks, 179,528 impressions and an average position of 10.3.
Month by Month
Growth was not perfectly linear—and that makes the result more credible. CampusMind established early traction, accelerated through spring, broke out in July and then reached a new high of 47,852 impressions in August.
Publishing begins and earns the first 13 campaign clicks.
The first full month establishes a repeatable search baseline.
New articles broaden discovery beyond CampusMind's brand name.
Visibility keeps compounding through the end of the year.
Monthly impressions move beyond 9,000 for the first time.
The site crosses 13,000 monthly impressions.
A normal month-to-month dip still holds above 10,000 impressions.
Growth resumes sharply and sets a new visibility record.
The content library approaches 20,000 impressions in one month.
Both visibility and clicks reach their strongest levels to date.
The strongest completed month more than doubles June's clicks.
CampusMind nearly reaches 48,000 impressions and surpasses July by 63%.
Source: Google Search Console. September is a partial launch month; October through August are completed calendar months.
Client Perspective
Top Performing Content
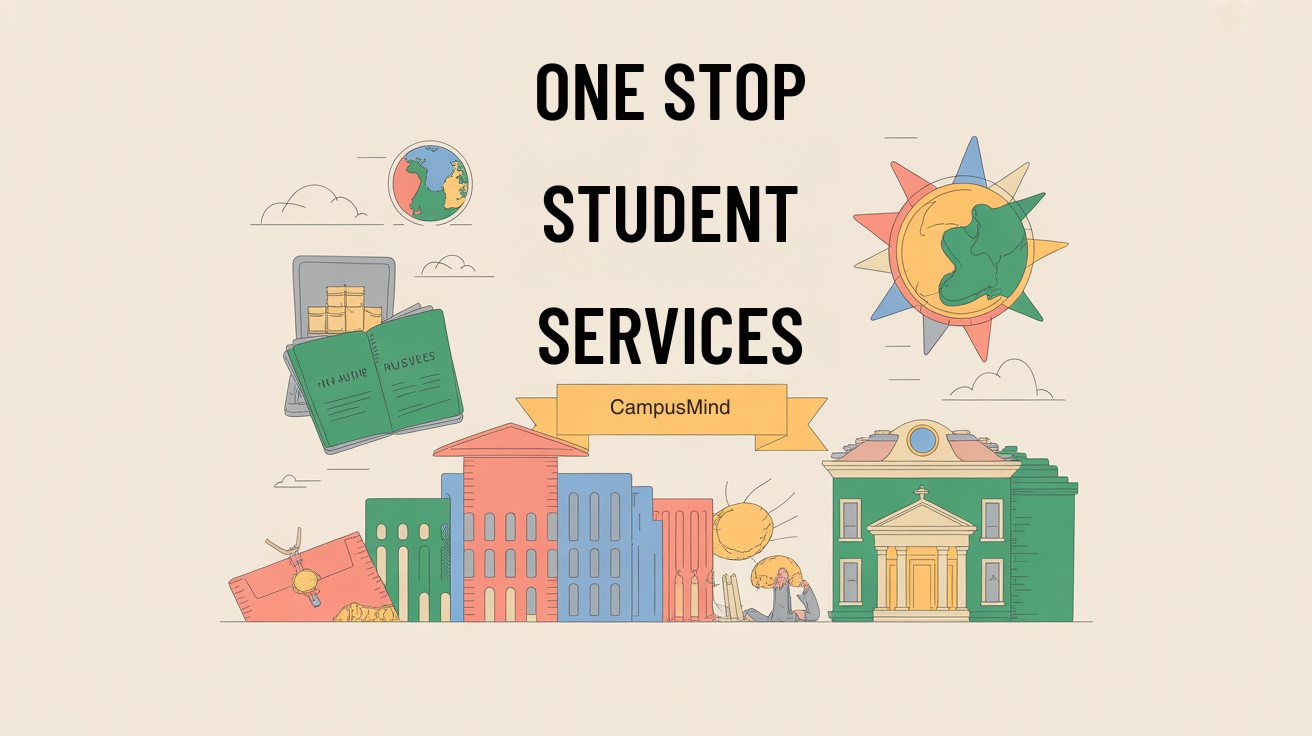
This article remained CampusMind's leading blog entry point, earning 231 Google clicks, 19,921 impressions and a 6.7 average position while answering a high-intent higher-education question.
| Top Blog Page | GSC Clicks | GSC Impressions | Avg. Position |
|---|---|---|---|
| One-Stop Student Services | 231 | 19,921 | 6.7 |
| Gender Enrollment Gap: Male College Students | 182 | 9,910 | 6.6 |
| College Dropout Reasons | 157 | 14,114 | 7.7 |
| Student Communication Strategies | 110 | 12,647 | 8.5 |
| Stop-Out Student Re-Enrollment Strategies | 98 | 13,429 | 9.5 |
GSC metrics cover the completed campaign period from Sep 16, 2025 through Aug 31, 2026.
Traffic Mix
From September 4, 2025 through August 31, 2026, CampusMind recorded 12,823 GA4 sessions. Conventional organic sources contributed 5,418 sessions (42.25%), while identifiable named AI sources added 849 (6.62%). Together, those discovery channels generated 6,267 sessions—nearly half of all measured traffic.

Earlier GA4 verification capture · Sep 4, 2025–Aug 15, 2026. Adjacent totals reflect the completed period through Aug 31.
AI discovery complemented conventional search and represented 6.62% of all measured sessions. GA4 attributed those visits to identifiable ChatGPT, Copilot, Perplexity, Gemini, Claude and NotebookLM source categories.
Named-source reporting may undercount AI-assisted visits that GA4 cannot identify.
Search Footprint
CampusMind began with branded queries only. By August 31, Google Search Console's campaign query table had reached its 1,000-row interface cap, with a 10.3 average position across a far broader search footprint.
“1,000 rows” is the current Search Console interface cap, not a claim of exactly 1,000 ranking keywords.
We'll identify the topics your market is already searching for, show you where competitors are leaving gaps, and map the first 90 days of a content engine built to compound.
Book a 20-Minute Strategy Call20 minutes · No obligation
More client results
More client results
Start with a free 7 Buyer Questions review for your home or property-service business. Get three priorities and a useful next step by email. No call or purchase required.
Clear website content that helps customers understand your service and take the next step.
© 2026 Mighty Quill. All rights reserved.